Are you struggling to build strong, authority-rich backlinks to your website?
You’re not the only one.
But with backlinks playing such a huge role in the SEO success of your entire website, how can you connect your business with one already praised by Google, and reap the rewards of being ranked higher in the Search Engine Results Pages (SERPs)?
The answer is simple: Start creating infographics.
In this guide, I’m sharing why infographics are your secret weapon when it comes to building high-quality links—and the step-by-step process we use at Discount Displays in order to create your own:
Why bother with infographics?
I know what you’re thinking: “There are hundreds of different content types I can use when I’m trying to build backlinks. What makes infographics so special?”.
…I’d question the same, too.
But consider this: Posts that include images (such as infographics) receive 650% higher engagement than text-only posts—a key factor that influences dwell time, which then influences rankings.
Infographics are liked and shared on social media 3x more than other any other type of content, too—another proven factor in search engine algorithms.
That’s why it’ll come as no surprise to learn that websites that publish infographics see a corresponding 12% growth in traffic. The more people who visit your website, the more opportunity you’ve got for them to love your infographic and link back to it.
The step-by-step process to use infographics for link-building
Are you convinced to start using infographics in your link-building strategy, yet?
Here’s the five-step process you’ll need to create, promote and build links from your new content:
1. Do your research
What will you base your infographic on?
Your answer to this question might sound obvious, but you’ll need to double-check the content you’re planning to create is in-demand, and likely to be picked up by publishers.
The infographic you create will need to be related to your business—that’s a no-brainer. But it’ll also need to be the type of content that’s related to popular, authoritative blogs in your industry, too.
For example: If you’re a car repair company, you might have an idea to base your infographic around key car maintenance tips that every owner should now.
Sounds good, right?
But when we plug “car maintenance tips” into Google Trends, the topic isn’t in-demand:
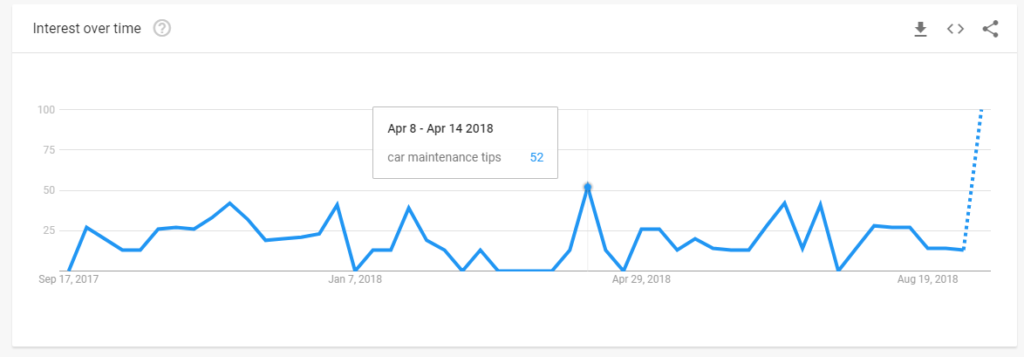
It’s better to create an infographic around an emerging trend or popularly searched-for topic, since this is what blogs and publishers want to share on their website.
Using that concept, let’s compare the Google Trends results for “car maintenance tips” with “driving electric cars”:
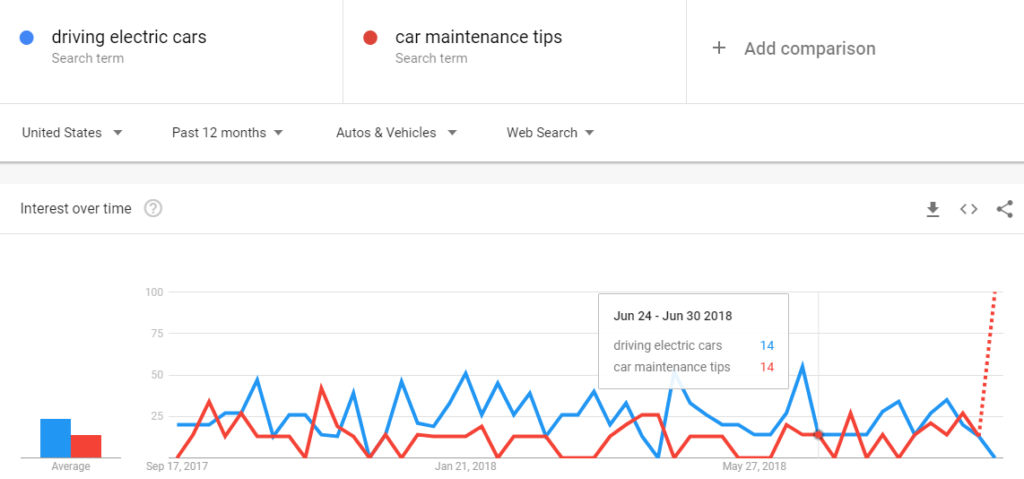
…Bingo!
The “driving electric cars” keyword has more monthly searches than “car maintenance tips”, as we can see from the Average section on the left-hand side—which is why the first option should form the basis of your infographic.
You should also check-out your competition at this stage by searching for the keyword plus “infographic”. This will give you a rough idea of how in-depth your infographic will need to be.
2. Create your infographic
Now you’ve got the basics covered, it’s time to move onto the fun part: Creating your infographic!
It’s wise to draft out your infographic on paper so you can see where each element slots together. But, tools like Canva can do this for you without too much effort.
To get started, head over to Canva and select one of their infographic templates:
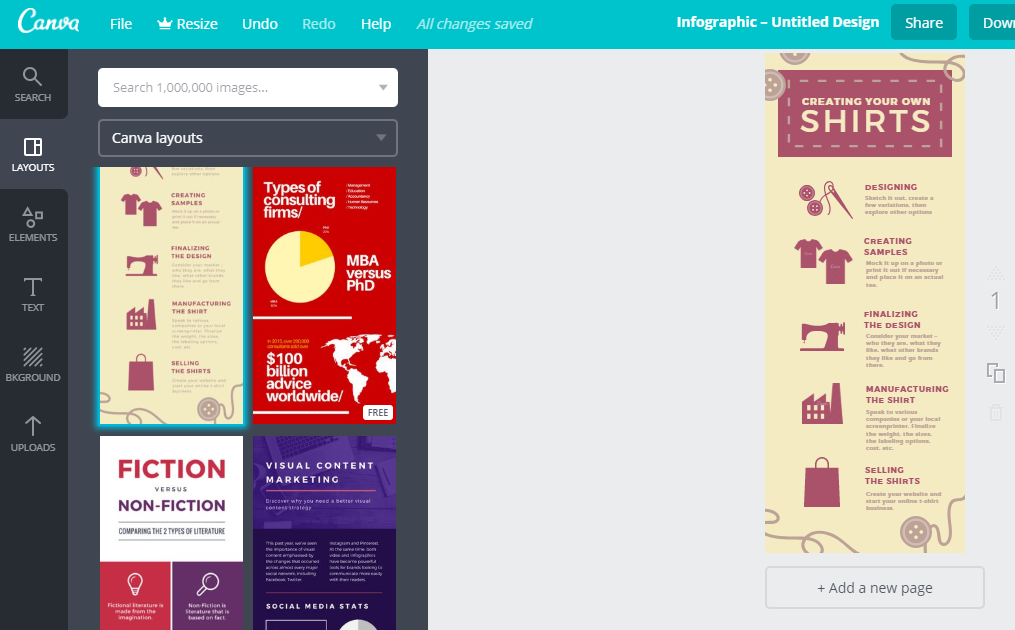
(Note: You can change the colours and fonts on either of these templates, so don’t worry about this too much.)
Once you’ve picked your template, all you’ve got left to do is add your content!
This step comes with a warning: Don’t fall into the trap of always creating a bog-standard infographic. There are various new forms of infographic you can use to capture your audience’s eye, including:
- Interactive maps
- Scrolling visuals
- 3D mock-ups
Just take a look at this interactive map that shows student debt in the U.S:
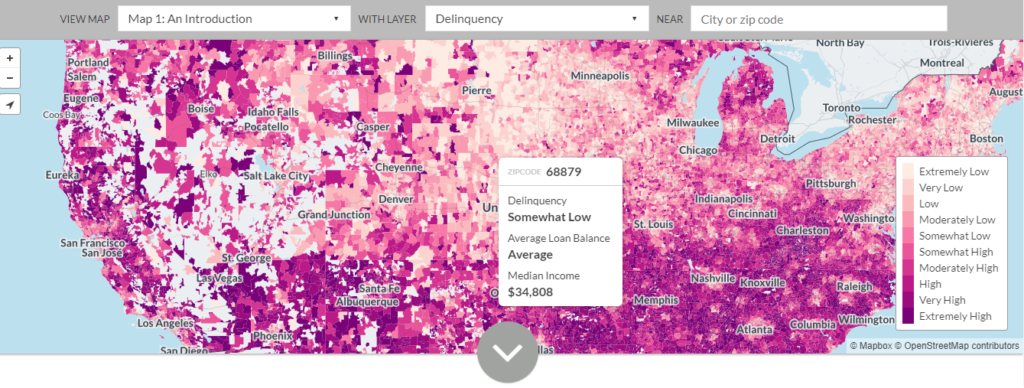
Although it’s technically classed as an infographic, I’ll bet you’re much more likely to engage (and link to) this type of content versus a bog-standard image, right?
If you fancy creating a customized map to base your infographic around, head over to MapHub—and start taking advantage of the 4-5x more pageviews that interactive content brings!
3. Upload to your website with accompanying text
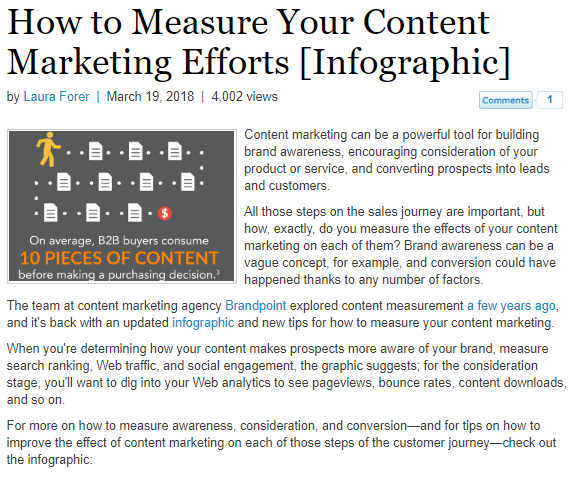
In order for people to link to your infographic, you’ll need to host the image somewhere on your website.
The best way to do this is to add the image to a blog post, and accompany it with relevant text—like this example on Marketing Profs’ website:
Why? It just sounds like more effort, right?
Trust me—the effort is worth it.
Uploading your infographic to your website gives publishers a place to link to. It’s impossible to collect backlinks without a place to direct people to.
But, the page you’ve uploaded it to (if it’s been optimized for on-page SEO) has the chance of ranking in Google for the keyword—giving you a chance to promote your image organically, and be found by publishers who’re actively looking to collect a link.
Make sure you’re including the focal keyword in your:
- URL structure
- Meta title and description
- Page title
- Heading tags
- Image alt text
…to make this possible.
4. Promote your infographic through owned channels
Now you’ve got a dedicated home for your infographic, let’s move onto organic promotion.
Search engines take several factors into account when deciding where a page should rank. Remember: Our aim is to reach the top spot and be positioned in front of publishers when they’re searching for supporting material—which is why you’ll need to work hard to make it seen.
Start by sharing the URL to your landing page through:
- Social media
- Online communities
- Forums
…to boost the number of eyes on your infographic.
Social shares, bounce rates and direct traffic are all well-known Google ranking factors, but proving your infographic is well-loved by your target audience also helps with credibility.
Think about it: If you’re a publisher looking to dish-out a link from your website, I’ll bet you’re much more likely to link to a URL that has thousands of social shares, rather than one with zero, right?
5. Send outreach emails to industry blogs
I’m a firm believer in “if you don’t ask, you don’t get”—even when it comes to link-building.
While optimizing your page to rank highly in the search engines can bring links organically, you might need to put in a little manual labour and ask for the links you’d love to have in your backlink profile.
Luckily for you, you don’t have to write the email yourself.
This template from HubSpot can be edited to include your business, infographic, and personalized ask:
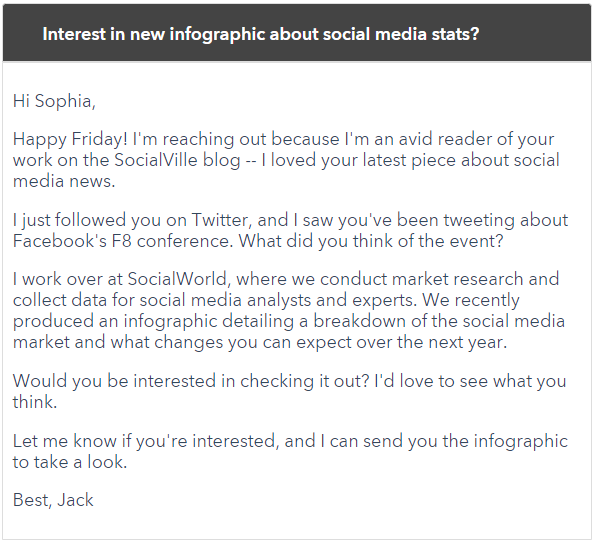
Notice how this email feels very personal—like the link-builder already knows the person they’re contacting? That’s because the best outreach emails are personalized. Whether you’re:
- Commenting on a recent event you both attended
- Congratulating the person on a recent launch they’ve done
- Mentioning how you saw one of their recent social media posts
…you’re building those personal connections, and proving you’ve taken the time to learn more about them.
Why wouldn’t they want to link to you and your awesome infographic?
Final thoughts on using infographics for link-building
As you can see, infographics have the power to form a strong basis for your link-building campaign.
Make sure you’re basing your image around an in-demand topic, creating a dedicated page on your website, and don’t be shy when asking other publishers to link to it from their website.
We can’t wait to see your infographics crop-up in my search feeds!