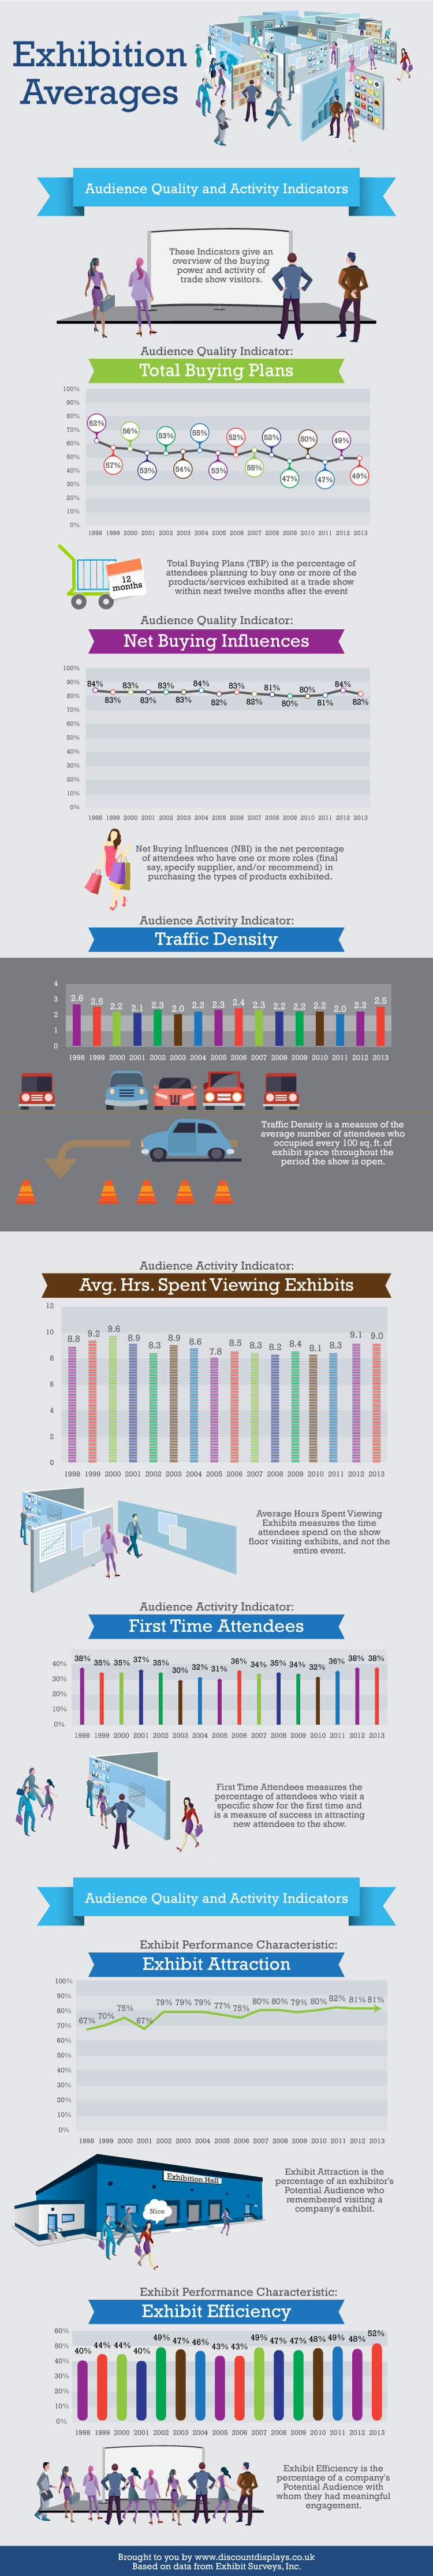
Based on recent data from Exhibit Surveys we have put together a neat infographic showing key audience and activity indicators at exhibitions from 1998 to 2013.
Having these key indicators in one place gives some great insights into trends and averages over the last 14 years, including traffic density, hours spent viewing exhibitions, and first time attendees.
If you are a business looking to step into your first exhibition or your fiftieth, the data below should aid in your cost-benefit analysis of exhibitions and your strategy once there for engaging audiences.